Montage Announces Koné Gold Project DFS with After-Tax NPV of $746M and 35% IRR
February 14, 2022
Vancouver, British Columbia — February 14, 2022 — Montage Gold Corp. (“Montage” or the “Company”) (TSXV: MAU) (OTCPK: MAUTF) is pleased to announce the results of the Definitive Feasibility Study (the “DFS” or the “Study”) for the Koné Gold Project (“Koné Gold Project”, “Project”, or “KGP”) in Côte d’Ivoire. The DFS was prepared by Lycopodium Minerals Pty Ltd. in accordance with Canadian Securities Administrators’ National Instrument 43-101 Standards of Disclosure for Mineral Projects (“NI 43-101”). Please note that all financial figures in this press release are in United States dollars, unless otherwise noted.
HIGHLIGHTS
- Significant Gold Reserves and Production – A Strategic Asset in Côte d’Ivoire
- 3.42Moz of Probable Mineral Reserves
- 3.06Moz of gold produced over a 14.8-year Life-of-Mine (“LOM”)
- Average annual gold production of 257koz in first 9 years; 207koz/year LOM
- Peak production 320koz in year 2
- Strong Financial Metrics with Improved Capital Efficiency
- $746M after-tax NPV5% and 35% IRR at base case $1,600 gold price
- $1,043M after-tax NPV5% and 47% IRR at $1,800 gold price
- LOM AISC1 of $933/payable oz
- All production from open pits with LOM strip ratio of 0.90:1
- Pre-production capital requirement of $544M
- Optimizations Improve Economics and Streamline Operations
- $153M reduction in sustaining capital vs. PEA
- 40% reduction in TSF surface area
- No road diversion
- Moving Forward to Unlock Value
- Permitting process well underway; all requisite approvals expected in Q3 2022
- Project financing process to commence soon
- Aggressive satellite pit exploration ongoing
- Well-funded with ~C$10M for permitting and exploration
Hugh Stuart, Montage CEO commented,
“The completion of the DFS for the Koné Gold Project is a tremendous milestone for Montage and is demonstrative of the hard work, dedication and expertise of our team. In the 15 months since our IPO, we have transformed Montage from an exploration company with a 1.5Moz Inferred Mineral Resource, into a development company with Probable Reserves of over 3.4Moz with anticipated average gold production of 257koz/year in the first 9 years, peaking at 320koz.
“We are clearly extremely pleased at how well the DFS compares to the May 2021 Preliminary Economic Assessment (“PEA”), with nearly all metrics improving, under the same base case gold price of $1,600/oz. Critical to these improvements are the numerous optimizations that were undertaken as part of the feasibility process, the most significant of which is the change in tailings management which has reduced our sustaining capital requirements by $146 million. We have also optimized the front-end of the mill through the use of High-Pressure Grinding Rolls instead of a SAG Mill, driving a 19% reduction in unit power requirements, a direct benefit to the operating cost profile. In addition, we have revised the mine plan to avoid diverting the newly asphalted road without any material impact to the production profile of the project.
“We will continue to move forward advancing the KGP to add value. We plan to engage project finance advisors in the near-term to solicit the market for capital for construction finance. Discussions thus far show strong support for the project from numerous potential funding partners, and we are excited to start that process. Permitting efforts continue and we are on pace to submit the ESIA at the end of this month to begin the government review process.
"Our balance sheet remains strong, with available liquidity of approximately C$10 million, which will provide us ample budget for regional exploration and the permitting process.”
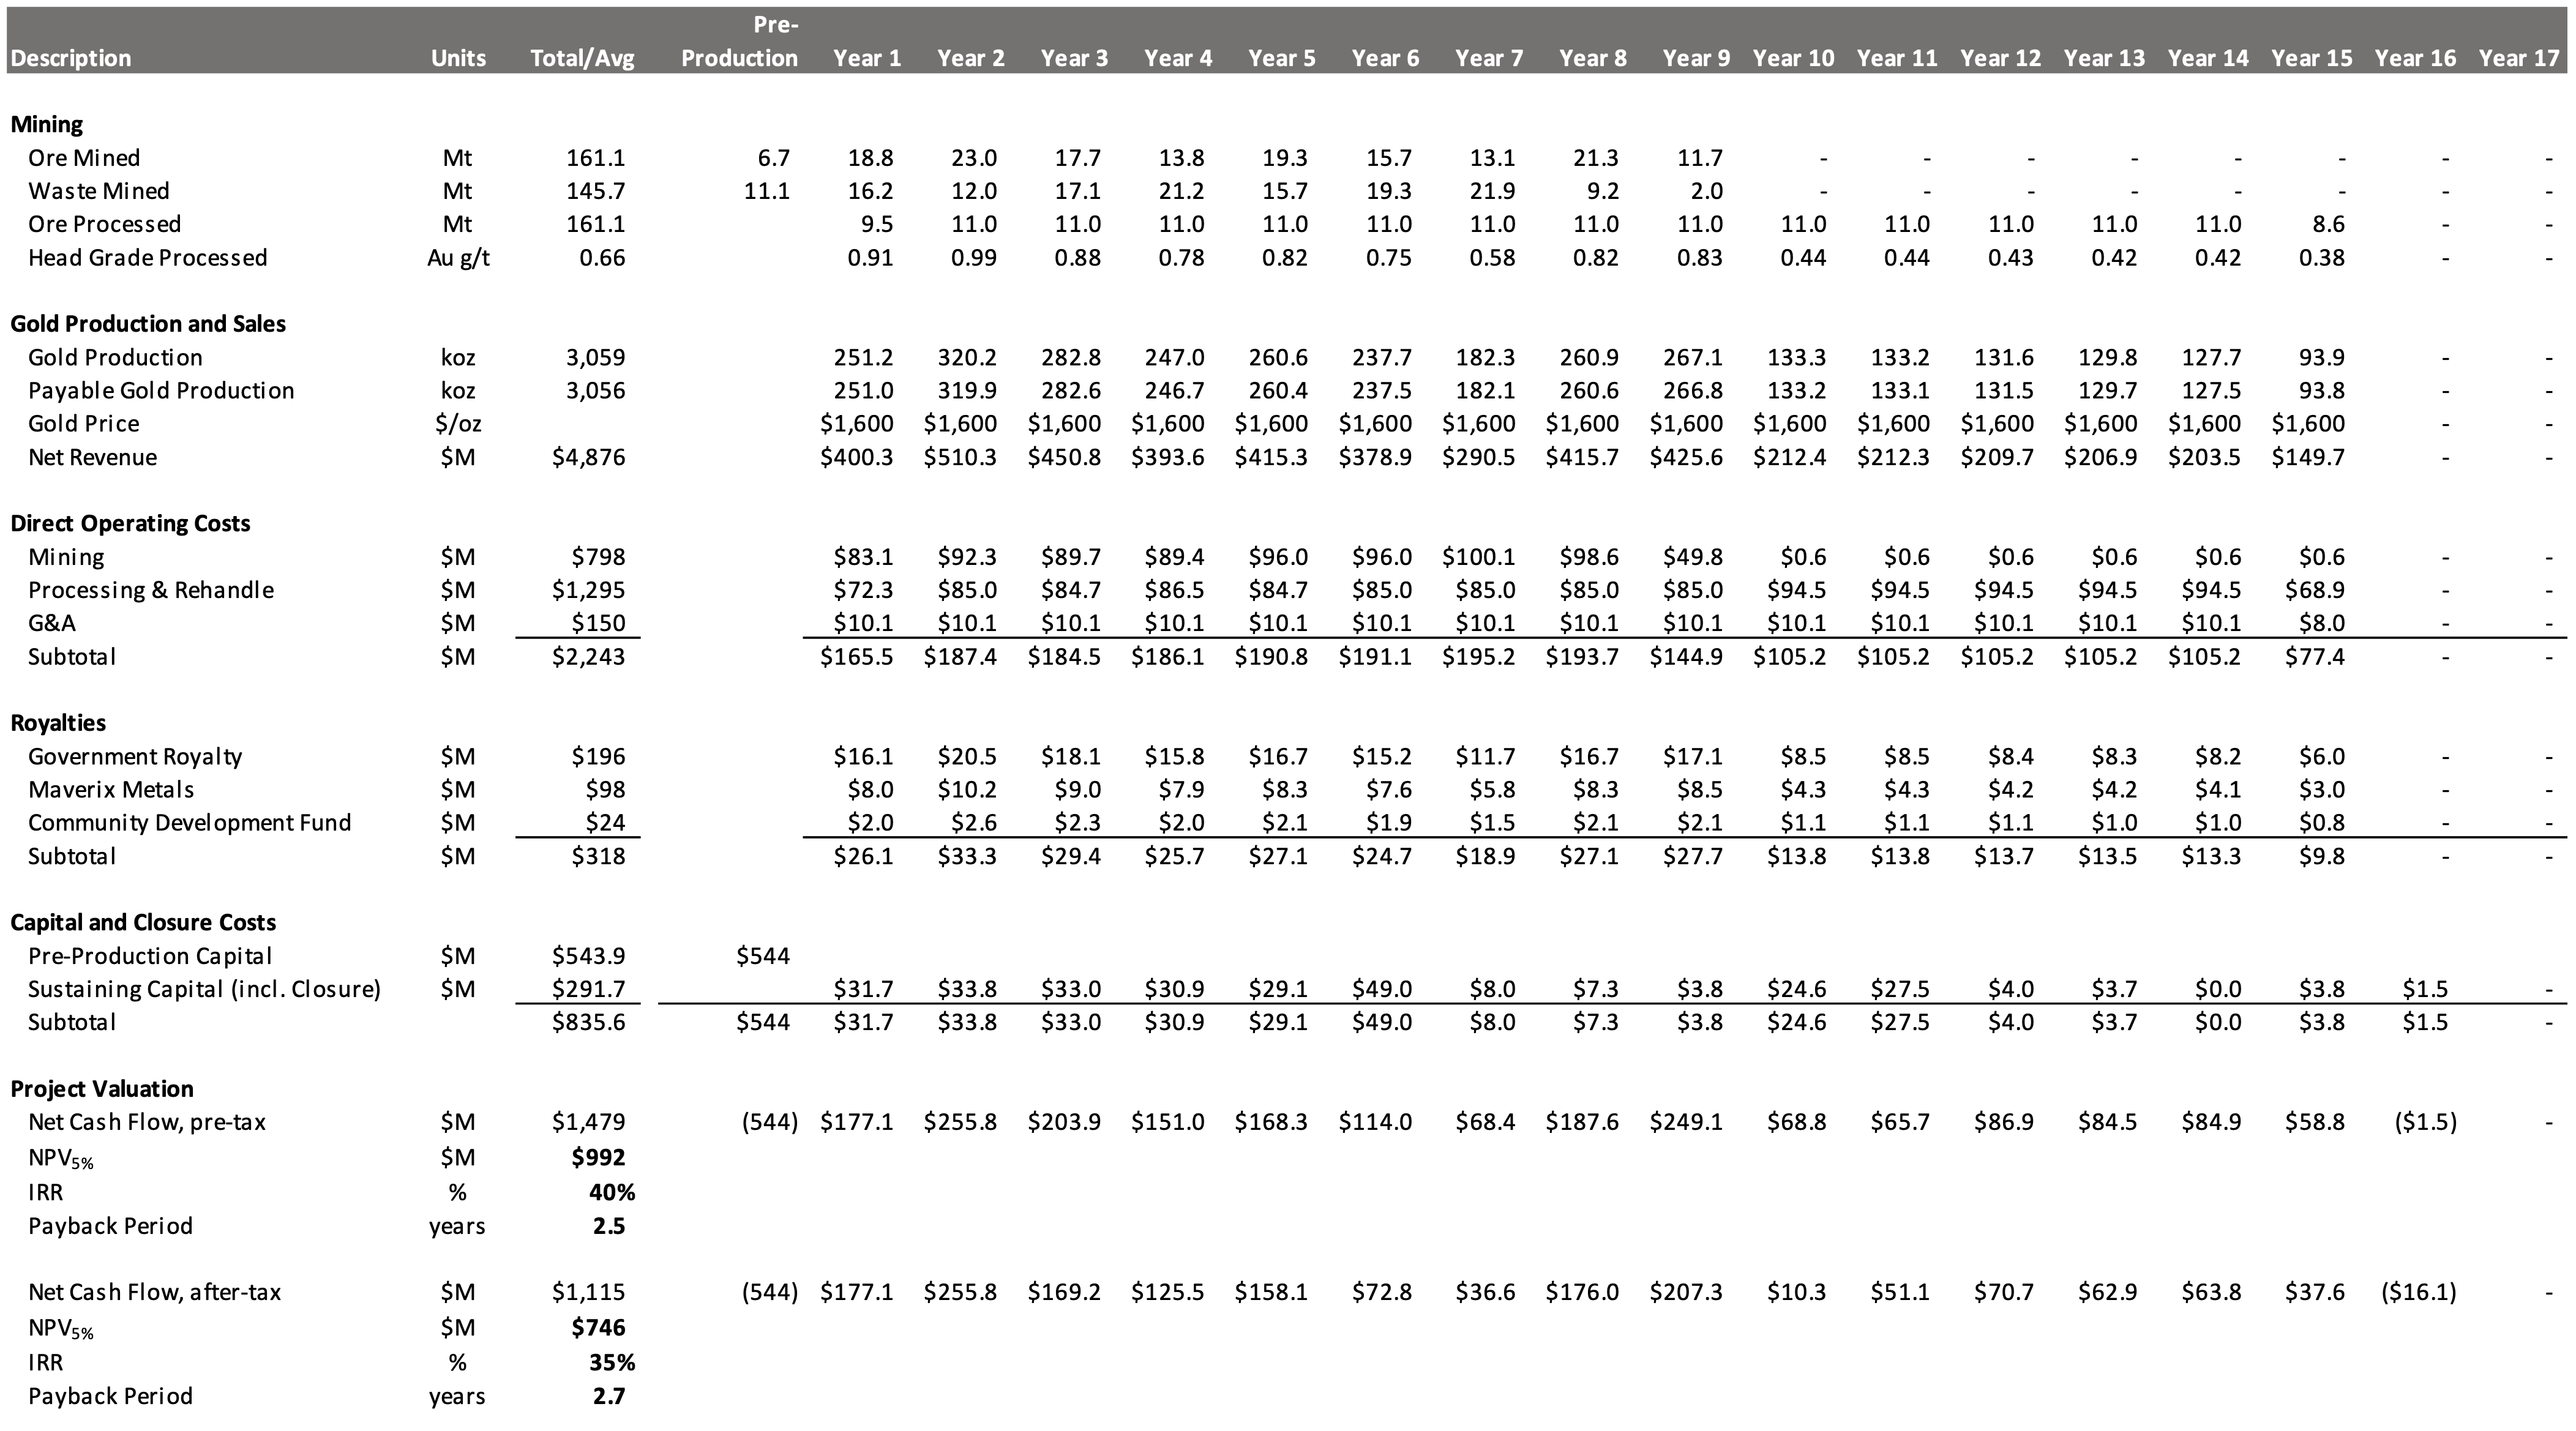
Summary operating and financial metrics from the DFS are presented in Table 1 below along with a comparison to the PEA. A summary model with annual projections over the project life has been included as Appendix 1 to this release.
Table 1 – DFS Summary Metrics
| Metrics | Units | DFS | PEA |
| Pit Optimization Gold Price Assumption | $/oz | $1,250 | $1,250 |
| Financial Model Base Case Gold Price | $/oz | $1,600 | $1,600 |
| Life of Mine | years | 14.8 | 14.7 |
| Total Mineralized Material Mined | Mt | 161.1 | 161.1 |
| Contained Gold | Moz | 3.42 | 3.37 |
| Strip Ratio | w:o | 0.90:1 | 0.93:1 |
| Annual Mining Rate | Mtpa | 35.0 | 35.0 |
| Annual Milling Rate (Mill Throughput) | Mtpa | 11.0 | 11.0 |
| Average Head Grade, first 3 years | Au g/t | 0.93 | 0.94 |
| Average Head Grade, first 9 Years | Au g/t | 0.82 | 0.79 |
| Average Head Grade, LOM | Au g/t | 0.66 | 0.65 |
| Processing Recovery, first 3 Years | % | 91.1% | 91.2% |
| Processing Recovery, first 9 Years | % | 90.2% | 90.2% |
| Processing Recovery, LOM | % | 89.3% | 89.4% |
| Total Gold Production, LOM | Moz | 3.06 | 3.01 |
| Average Gold Production, first 3 years | koz/yr | 285 | 294 |
| Average Gold Production, first 9 years | koz/yr | 257 | 249 |
| Average Gold Production, LOM | koz/yr | 207 | 205 |
| Mining Cost Per Tonne Mined, LOM | $/t, mined | $2.73 | $2.90 |
| Processing Cost, LOM (including rehandle) | $/t, processed | $8.04 | $7.20 |
| G&A, LOM | $/t, processed | $0.93 | $0.86 |
| Royalties, LOM | $/t, processed | $1.97 | $1.93 |
| Total Cash Costs1, LOM | $/t, processed | $15.89 | $15.39 |
| Average AISC1, LOM | $/payable oz | $933 | $975 |
| Initial Capital Expenditure (including contingency) | $M | $543.9 | $489.9 |
| Sustaining Capital (incl. Closure) | $M | $291.7 | $444.9 |
| NPV5%, pre-tax (100%) | $M | $991.7 | $928.7 |
| Pre-tax IRR | % | 39.6% | 45.1% |
| NPV5%, after-tax (100%) | $M | $746.2 | $652.2 |
| After-tax IRR | % | 34.8% | 30.9% |
| Payback Period | years | 2.7 | 2.8 |
DETAILS
Koné Gold Project Overview
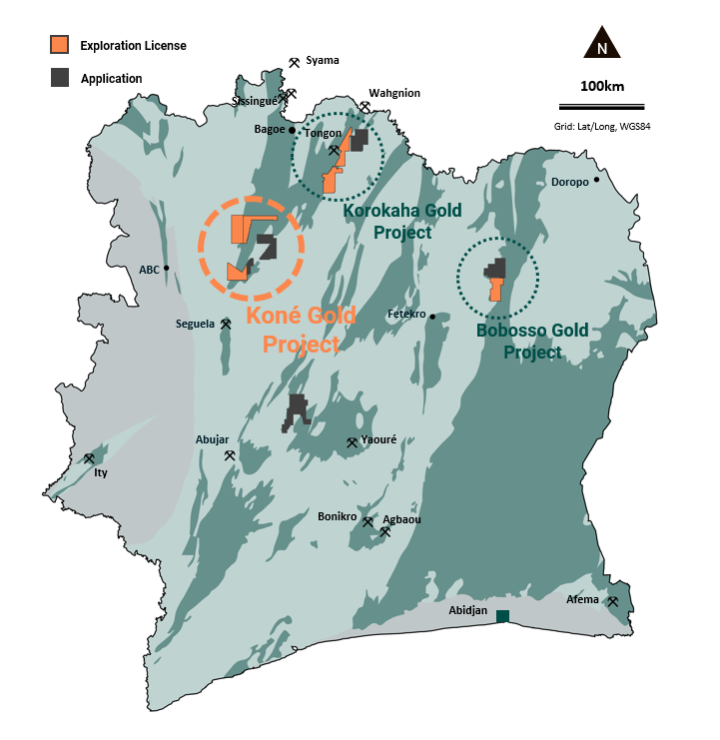
The Koné Gold Project is located approximately 590km north-west of Abidjan (Figure 1), the commercial capital of Côte d’Ivoire. The Project comprises two exploration permits (PR262 and PR748) covering 662km2, a third exploration permit pending documentation (382km2), and two applications covering a further 398km2 all within trucking distance of Koné (Figure 1).
The communities of Fadiadougou and Batogo lie 5km east and west respectively of the resource area with the nearest major centre at Séguéla, 80km to the south. The Project area is accessible year-round with an asphalt highway within 500m of the proposed plant location.
The Project area and is largely devoid of habitation with subsistence farming and cashew plantations the dominant land use.
Mineral Resources and Reserves Estimates
Mineral Resources were estimated for the Koné deposit by Multiple Indicator Kriging (“MIK”) by MPR Geological Consultants Pty Ltd. Based on 102,249m drilling completed up to July 31, 2021. Table 2 shows the Indicated and Inferred Mineral Resource estimates at a range of cut-off grades reported within an optimal pit shell generated at a gold price of $1,500/oz.
Table 2 – Mineral Resource Estimate
| Cut-off Grade | Indicated | Inferred | ||||
| Au g/t | Mt | Au g/t | Au Moz | Mt | Au g/t | Au Moz |
| 0.1 | 278 | 0.51 | 4.56 | 32 | 0.35 | 0.36 |
| 0.2 | 225 | 0.59 | 4.27 | 22 | 0.45 | 0.32 |
| 0.3 | 168 | 0.70 | 3.78 | 14 | 0.56 | 0.25 |
| 0.4 | 128 | 0.82 | 3.37 | 9.0 | 0.69 | 0.20 |
| 0.5 | 99.1 | 0.92 | 2.93 | 5.9 | 0.81 | 0.16 |
| 0.6 | 76.9 | 1.03 | 2.55 | 3.9 | 0.95 | 0.12 |
| 0.7 | 59.9 | 1.14 | 2.20 | 3.2 | 1.1 | 0.10 |
| 0.8 | 46.8 | 1.25 | 1.88 | 1.9 | 1.2 | 0.07 |
Notes
- Indicated Mineral Resources and Inferred Mineral Resources are reported in accordance with NI 43-101 with an effective date of August 12, 2021, for the Koné deposit within the KGP.
- The updated mineral resource estimate is reported on a 100% basis and is constrained within an optimal pit shell generated at a gold price of US$1,500/ounce.
- The identified Mineral Resources are classified according to the “CIM” definitions of Indicated Mineral Resources and Inferred Mineral Resources.
- The updated mineral resource estimate was prepared by Mr. Jonathon Abbott of MPR Geological Consultants of Perth, Australia who is a Qualified Person as defined by NI 43-101.
- The estimates at 0.2g/t cut-off grade represent the base case or preferred scenario.
- Mineral Resources are reported inclusive of Mineral Reserves.
- Mineral Resources that are not Mineral Reserves do not have demonstrated economic viability.
- The estimates may be materially affected by environmental, permitting, legal, marketing, or other relevant issues. Please see “Forward Looking Statements” below and the technical report for the Koné Gold Project that will be prepared in accordance with National Instrument 43-101 and filed on SEDAR.
The maiden Mineral Reserve estimate was prepared by Carci Mining Consultants Ltd., dated as of February 14, 2022 and is presented below in Table 3. Only Probable Reserves have been incorporated into the mine plan and economic analysis.
Table 3 – Open Pit Mineral Reserve Estimate
| Oxide | Transition | Fresh | Total | ||||||||||
| Classification | Mt | Au g/t |
Au Moz |
Mt | Au g/t |
Au Moz |
Mt | Au g/t |
Au Moz |
Mt | Au g/t |
Au Moz |
|
| South Pit | Probable | 9.8 | 0.57 | 0.18 | 7.9 | 0.56 | 0.14 | 141.4 | 0.67 | 3.05 | 159.1 | 0.66 | 3.39 |
| North Pit | Probable | 0.9 | 0.47 | 0.01 | 0.4 | 0.46 | 0.01 | 0.6 | 0.57 | 0.01 | 1.9 | 0.50 | 0.03 |
| Total | Probable | 10.7 | 0.56 | 0.19 | 8.3 | 0.56 | 0.15 | 142.1 | 0.67 | 3.06 | 161.1 | 0.66 | 3.42 |
Notes
- The Mineral Reserves are classified according to the “CIM” definitions with an effective date of February 14, 2022.
- All Mineral Reserves were classified as Probable based on the Indicated Mineral Resource
- The Mineral Reserve cut off grade range from 0.19 g/t to 0.31g/t based on a $1,250/oz gold price
- The Mineral Reserve statement was prepared by Joeline McGrath of Carci Mining Consultants Ltd. who is a Qualified Person as defined by NI 43-101.
- The figures in this tables are rounded to reflect the precision of the estimates and may include rounding errors.
- The estimates may be materially affected by environmental, permitting, legal, marketing, or other relevant issues. Please see “Forward Looking Statements” below and the technical report for the Koné Gold Project that will be prepared in accordance with National Instrument 43-101 and filed on SEDAR.
Definitive Feasibility Study Overview
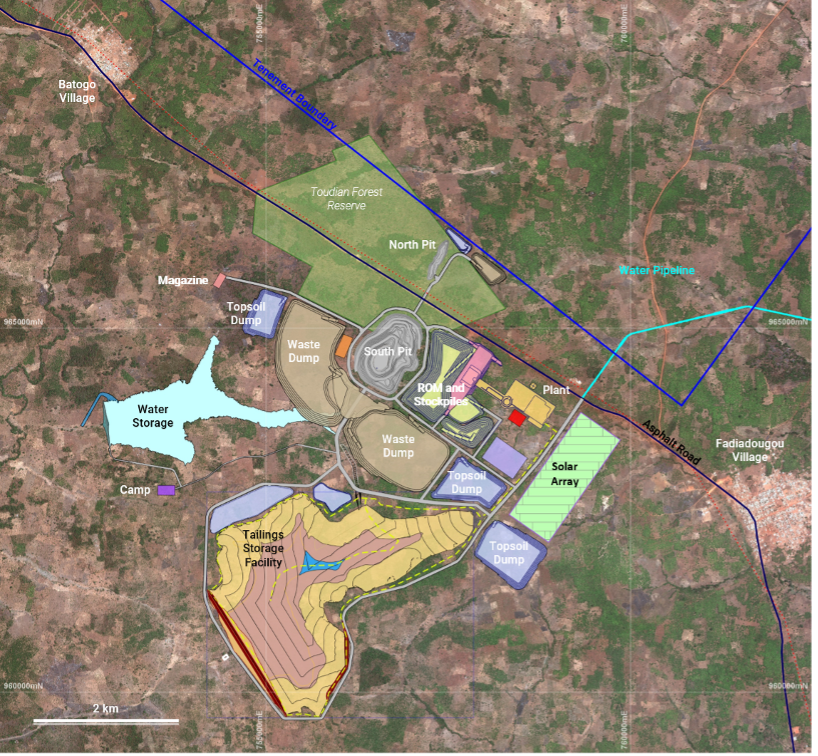
The DFS is based on an open-pit gold mine feeding a gold processing facility (Figure 2). The Project will produce an average of approximately 207,000 ounces of gold per year over the life of the mine. The initial life of the Project is 14.8 years with upside potential through regional exploration and identification of satellite pits targeted at higher grades that can be mined and trucked to a central processing facility.
Initial capital to fund construction and commissioning is estimated at $543.9 million with total capital estimated at $835.6 million over the LOM including closure costs. All-in sustaining costs1 are estimated at $787 per ounce during the first three years of the Project, well below the current industry average, and $933 per ounce over the life of the Project. Processing costs of just $8.04/t position the Project to take advantage of processing satellite pits identified through exploration.
The financial analysis performed from the results of this DFS demonstrates the economic viability of the Koné Gold Project using the base case gold price assumption of $1,600 per ounce. This results in an after-tax net present value cashflow at a 5% discount rate (NPV5%) of $746.2 million and an after-tax IRR of 34.8% (both on a 100% basis).
The Company believes there are additional opportunities to further strengthen the Project through the continued drilling and testing of satellite pit targets through the property package.
The study was prepared for Montage by Lycopodium Minerals Pty Ltd. Other discipline specific consultants were:
- Mineral Resource Estimate: MPR Geological Consultants Pty Ltd.
- Metallurgical Testwork: SGS Lakefield
- Metallurgical oversight: MPH Minerals Consultancy Ltd.
- Tailings and Water Storage: Knight Piésold Pty Ltd.
- Hydrogeology: Australasian Groundwater & Environmental Consultants (AGE)
- Environment: Mineesia Ltd.
- Mineral Reserve Estimate and Mining: Carci Mining Consultants Ltd
Key Differences in Project Scope Compared to PEA
As part of the feasibility process, several areas of the Project were re-evaluated to optimize the DFS:
- The tailings storage strategy was revised to incorporate in-pit deposition after open pit mining is completed in year 9. This reduces sustaining capital by $146.4M compared to the PEA, reduces the surface footprint of the TSF by 40% and mitigates environmental impact (Figure 2).
- The mine plan was revised to reduce the size of the North Pit such that road diversion could be avoided. This has minimal economic impact but improves the Project permitting process due to the reduction of the footprint within the Toundia Forest Reserve.
- Replacement of the SAG Mill with High-Pressure Grinding Rolls. The use of HPGR’s reduces the power required for grinding by 19%, positively impacting operating costs.
Mining
Mining operations will be carried out by a contractor on a unit cost per tonne basis utilising a mining fleet comprised of 145t rigid body haul trucks with suitably sized loading units at a rate of 35Mtpa. The grade of the processed material in the first nine years is enhanced by using an elevated cut off grade and stockpiling the lower grade material for later processing.
Pit optimizations were completed based on slope angle recommendations from SRK Consulting of 48° for oxide, 68° for transition and 68° for fresh rock. The overall slope angle inclusive of ramps and berms is approximately 55°.
The optimizations were run using estimates of processing cost and recovery data. Mining costs were broken into base and incremental mining costs, derived from competitive bids received from West African mining contractors.
A gold price of $1,250/oz was used for the optimisation along with the following royalty assumptions: i) a sliding scale royalty payable to the government of Côte d’Ivoire, 3.5% at $1,250/oz Au; ii) a 2% royalty payable to Maverix Metals Inc.; and iii) a 0.5% community development fund royalty.
Pit designs (Figure 3) were completed for the Koné deposit which will be exploited through two pits, a smaller northern pit which reaches a depth of 55m and a larger southern pit which extends to a depth of 470m.
The overall strip ratio is 0.90:1, a reduction compared to the PEA.
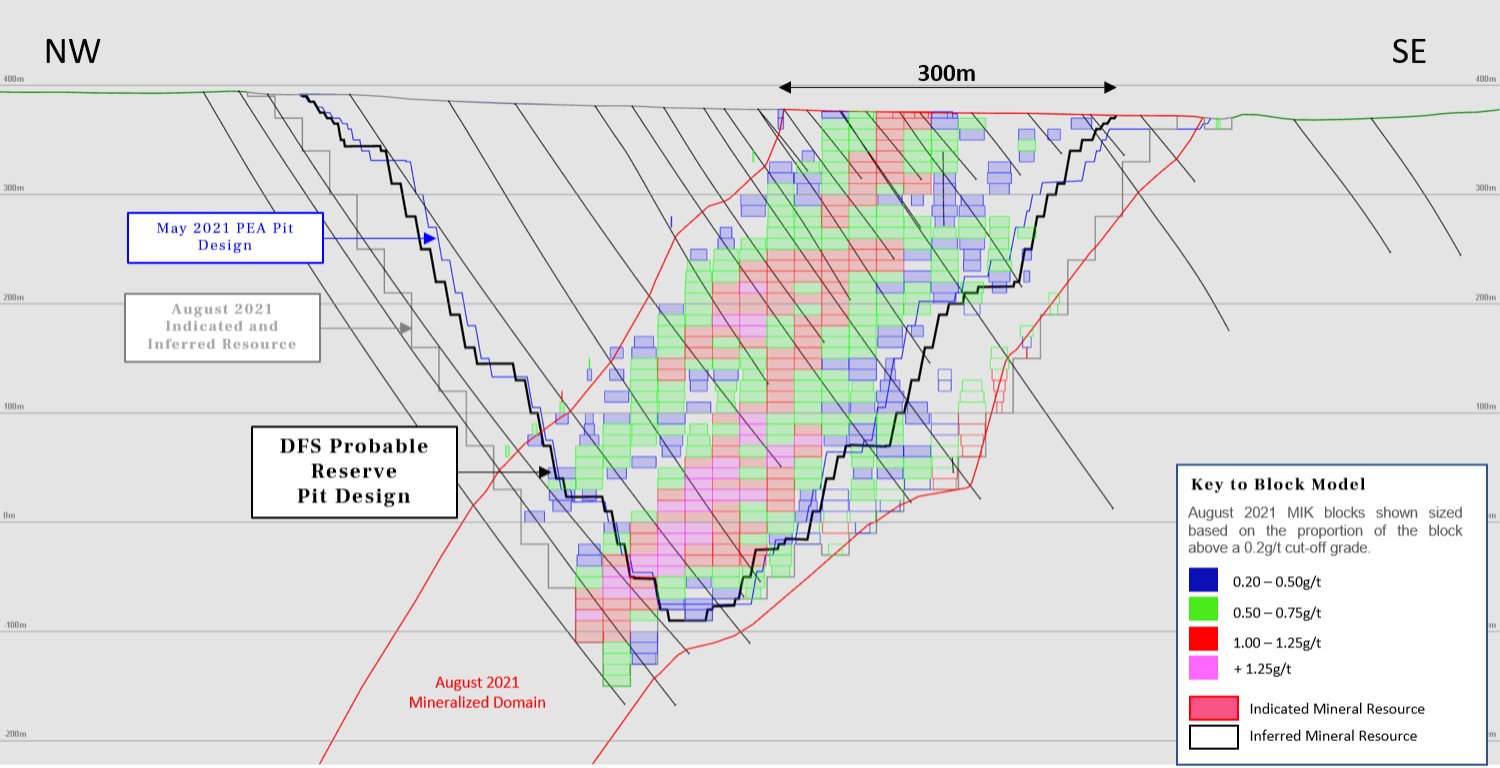
Figure 4 shows the mine schedule and Figure 5 shows the processing schedule with the higher-grade feed material being processed during the first nine years of mine life with the stockpiled lower grade material processed after the completion of mining operations.
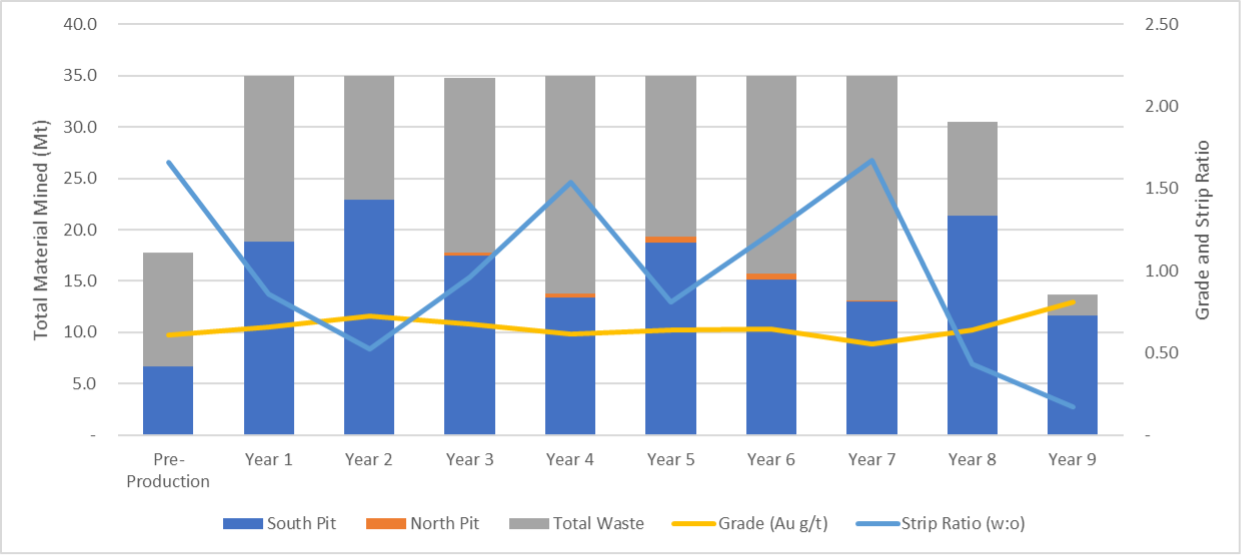
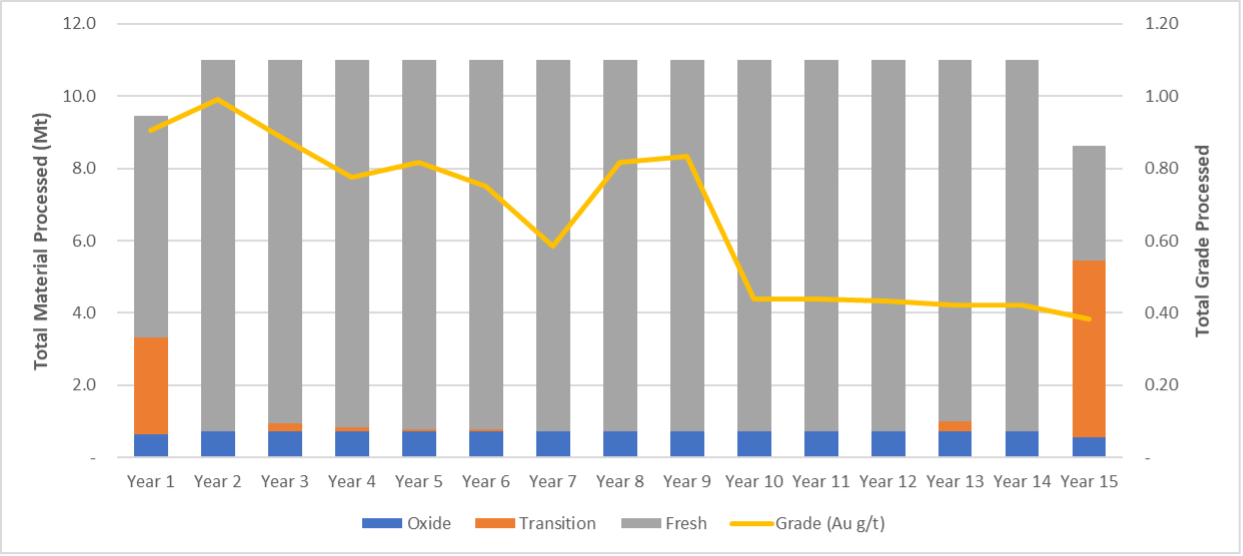
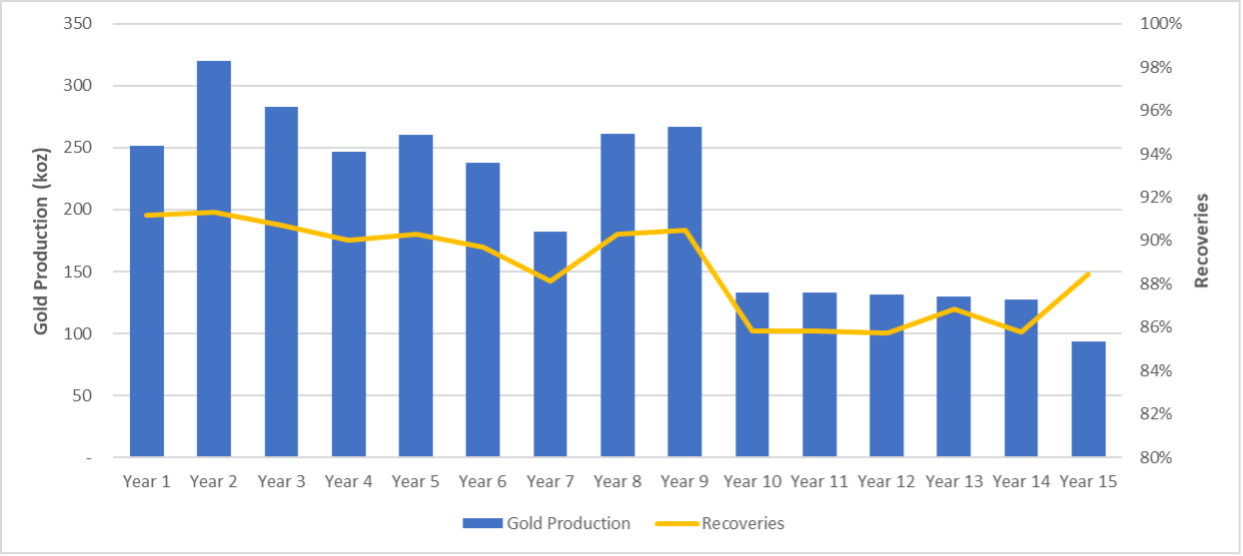
Figure 6 shows forecasted gold production and processing recoveries. The south pit will be used to store the tailings generated over the last 6 years of the project life.
Metallurgy
A comprehensive testwork program was carried by SGS Lakefield on 65 comminution and 130 leach optimization and variability samples representing range of material and rock types at the Koné deposit.
The testwork program demonstrated that the Koné deposit mineralization is amenable to direct tank leach carbon in pulp cyanide leaching with good gold recoveries, low reagent consumptions and medium-low resistance to grinding providing favourable processing economics and a simple flowsheet.
Table 4 shows the forecast gold recoveries and reagent consumptions at the average LOM grades. Forecast gold recoveries were estimated based on variable residue grades related to feed grade, a solution loss of 0.005mg/l gold and carbon fines loss of 0.15%.
Cyanide consumption is low to very low and lime consumption is low for the dominant fresh material (88%), but higher for the less dominant transition (5%) and oxide (7%) zones.
Table 5 shows the comminution results. The fresh mineralization is soft in terms of resistance to ball milling and crushing with medium abrasivity. The SAG mill test data have been used in the design of the High-Pressure Grinding Rolls (HPGR).
Table 4 – Metallurgical Testwork Summary
| Samples Tested | Domain | LOM Plant Feed (%) |
Average LOM Grade (Au g/t) |
Forecast Recovery (%) |
Cyanide Consumption (kg/t) |
Lime Consumption (kg/t) |
| 53 | South HW Fresh | 77.1% | 0.69 | 89.10 | 0.26 | 0.55 |
| 12 | North HW Fresh | 0.3% | 0.56 | 78.13 | 0.37 | 0.43 |
| 13 | South FW Fresh | 10.8% | 0.55 | 87.65 | 0.23 | 0.45 |
| 17 | South Transition | 4.9% | 0.56 | 91.23 | 0.18 | 0.99 |
| 5 | North Transition | 0.2% | 0.46 | 88.06 | 0.35 | 0.75 |
| 21 | South Oxide | 6.1% | 0.57 | 93.79 | 0.18 | 2.50 |
| 9 | North Oxide | 0.6% | 0.47 | 94.17 | 0.13 | 2.79 |
| 130 | All Domains Average | 100% | 0.66 | 89.30 | 0.25 | 0.70 |
Table 5 – Comminution Testwork for Fresh Rock
| Test | Samples Tested | Units | Average | SGS Lakefield Classification |
| Bond Ball Mill Work Index | 54 | kWh/t | 11.4 | Soft |
| SAG Milling Index | 53 | A x b | 31.3 | Moderate |
| Crusher Work Index | 11 | kWh/t | 17.0 | Medium |
| Abrasion Index | 10 | g | 0.419 | Medium |
Process Plant
The process plant design is based on a simple and robust metallurgical flowsheet designed for optimal precious metal recovery. The key design criteria for the plant are:
- Nominal throughput of 11.0 Mtpa with a grind size of 80% passing (P80) 75 µm.
- Process plant availability of 91.3% supported by the selection of standby equipment in critical areas
- The treatment plant design incorporates the following unit process operations:
- Primary and closed-circuit secondary crushing using a gyratory crusher and two cone crushers to produce a crushed product size P80 of approximately 38mm.
- A crushed feed stockpile with a nominal live capacity of 22,000 wet tonnes, providing buffer storage of crushed ore with continuous reclaim feeders for the HPGR-ball mill comminution circuit.
- Two parallel HPGRs in closed circuit with wet sizing screens, with undersize slurry reporting to the milling circuit via the cyclone feed hopper. Two parallel trains of ball mills in closed circuit with hydrocyclones will produce a P80 grind size of 75 µm.
- Pre-leach thickening to increase the slurry density feeding the leach and carbon in pulp (“CIP”) circuit to minimise tankage and reduce overall reagent consumption.
- Leach circuit incorporating 14 leach tanks, arranged in two parallel trains of 7 each in series, to provide 36 hours leach residence time, and equipped with external oxygen contactors
- A Kemix Pumpcell CIP circuit consisting of eight tanks for recovery of gold onto carbon, to minimize carbon inventory, gold in circuit and operating costs. The CIP and elution circuit design is based on daily carbon harvesting.
- 20 tonne elution circuit, electrowinning and gold smelting to recover gold from the loaded carbon to produce a gold/silver doré.
- Tailings thickening to recover and recycle process water from the CIP tailings.
- Tailings pumping to the tailings storage facility (“TSF”).
Project Infrastructure
Water
Subject to final approval by government authorities, water will be sourced from the nearby Marahoué river, from pit dewatering and a supplementary borefield.
The river abstraction facility will be constructed adjacent to the Marahoué River at a location approximately 26 km east of the WSF. The facility will comprise a sump to allow for harvesting of water by a pump mounted on a floating pontoon. Pumping will not take place in dry period from January to May. Hydrological assessment of the river catchment indicates that the river will have sufficient excess flow during this period and will not affect downstream users.
Harvested river water, pit de-watering and supplementary borefield water will be pumped to an off-stream water storage facility (“WSF”). Surface runoff from the mining area, ROM pad and stockpiles will gravity flow to this WSF. The WSF will have a capacity of approximately 7.2 million m3 and will enable accumulation of water during the wet season and a gradual drawdown in the dry season. In addition, water will be recycled from the tailings storage facility to the process water pond.
Tailings
The TSF will comprise of a single cell confined by a cross valley embankment which will be raised annually until the mining in south pit is completed in year 9.
The TSF basin will be lined with HDPE within the normal operating pond areas and a compacted soil liner elsewhere to reduce seepage. In addition, a system of underdrainage, embankment drainage and sub-liner drainage will be constructed to reduce seepage and aid consolidation of the tailings. Tailings will be deposited subaerially with the supernatant pond located away from the embankment. Water will be recovered from the supernatant pond by a suction pump with floating intake located in a channel excavated adjacent to an access causeway.
Following the completion of the mining in year 9, tailings will be deposited into the south pit via four spigots located around the perimeter of the pit. Water will be extracted from the decant pond using floating intake lines to position the pumps above the pond elevation. The pond volume will be at its highest at the first year as the TSF pond will be pumped to the pit to let the TSF commence the closure process.
The TSF will be closed and rehabilitated after deposition is transferred to the pit. Closure spillways will be formed to prevent water accumulating on the facilities and a waste rock cover will be placed over the tailings prior to topsoiling and revegetation.
Power
The DFS evaluated hybrid power supply options from proposals received from West African power providers.
The Koné Gold Project process plant is estimated to have a maximum demand of 44.8 MW, an average annual demand of 37 MW with an expected energy consumption of 303GWhr/yr.
The solar farm will generate on average 22.7MW of solar energy which will be coupled with 8.8MW of Battery Energy Storage System (BESS). Solar generation will account for 16% of the demand.
The capital cost estimate for this LNG/Solar/BESS hybrid power station estimated $138M comprising annual repayments of $20.0M and a transfer payment of $38M in year 6. The operating cost is estimated at $0.0998/kWhr.
The solar PV and BESS integration is expected to save in the order of 23,000 tonnes/year of CO2 emissions compared to the stand-alone LNG power plant. Dedicated hybrid power station control systems will be utilised to optimise the renewable energy yield whilst ensuring the security and reliability of the power supply is maintained at a very high level.
Environmental
Under the Mining Code, all applicants for an exploitation licence must submit an Environmental and Social Impact Assessment (“ESIA”) to the Agence Nationale de L’Environment (“ANDE”), the authority in charge of supervising, validating and controlling environmental impact studies. Montage is currently in the process of compiling the ESIA which is 95% complete. There are currently no objections to the development of the Project.
Mining of the North Pit will affect 9% of the Toudian Forest Reserve and discussions with the Ministry of Water and Forests have commenced to obtain authorization. The impact of the project on the forest reserve has been assessed during the ESIA and the DFS includes provision for the backfilling and re-habilitation of all but 14ha during operations and will be complemented by re-planting of the more degraded areas of the forest.
Permitting
The development of the Project will be subject to the following permitting process:
- Completion and submission of ESIA to ANDE.
- Receipt of environmental approval of its design and environmental management program.
- Application for and receipt of a Mining Permit (valid for 10 years renewable).
- Negotiation of a Mining Convention.
Montage expects to submit the ESIA to ANDE by early March and is working with ANDE to schedule the next steps to finalize the approval of the ESIA. In parallel with this process, Montage is preparing the Mining Permit application and Mining Convention with assistance from local advisors. Based on current expectations, Montage believes it will be possible to receive final permits and approvals in Q3 of this year.
Capital Costs Summary
Capital cost estimates are summarized in Table 6 and Table 7. The initial project capital cost is estimated at $543.9M, including a contingency allowance of $50.5M.
Table 6 – Pre-Production Capital Cost Estimate Summary (±15%)
| Main Area | Value ($M) |
| Pre-Production Mining | $39.6 |
| Process Plant | $320.7 |
| Tailings and Water Storage | $50.6 |
| Camp | $3.3 |
| Resettlement | $9.5 |
| EPCM | $39.4 |
| Owners Costs | $30.3 |
| Subtotal | $493.3 |
| Contingency | $50.5 |
| Grand Total | $543.9 |
Compared to the PEA, pre-production capital cost has increased by $53.9M. Replacing the SAG Mill with HPGRs represents approximately $20M of the increase but has resulted in a 19% reduction in annual unit power consumption (and a cost savings of $0.28/t processed, using constant energy costs). Increased freight costs have added $11M, indicative of current supply chain disruptions attributable to the ongoing COVID-19 pandemic. The remaining increase is derived from general cost increases in other capital items.
The duration of the detailed design and construction phase of the Project has been estimated to be 31 months commencing with the construction of the Marahoué pump station and WSF. The plant is estimated to take 27 months to construct. Mining will commence 15 months prior to start of processing.
The total LOM capital cost is estimated at $835.6M, including sustaining capital and closure costs of $291.7M, as shown in Table 7. The LNG/solar power plant and the camp will be financed under 5-year Build Own Operate Transfer (“BOOT”) contracts.
Table 7 – Sustaining Capital Cost Estimate Summary (±15%)
| Main Area | Value ($M) |
| Camp | $5.7 |
| Power | $138.0 |
| Tailings Storage Facility | $59.4 |
| Process Plant | $31.9 |
| Closure | $56.7 |
| Grand Total | $291.7 |
Sustaining capital estimates are down $153.2M compared to the PEA, driven in large part by the changes to TSF ($146.4M reduction) and associated reduction in closure costs ($9.9M reduction).
Taken as a whole, these changes have resulted in a $42/oz reduction in LOM AISC1 versus the PEA, which is a significant change and solidifies the economic potential of the Project.
Operating Costs Summary
Contract open pit mining costs were derived from a tender process involving several West African mining contractors who were provided a detailed mining plan for the Koné deposit. The average open pit operating cost ($/t mined) is shown in Table 8. A diesel price of $0.85/l was used.
Table 8 – Mining Costs
| Ore ($/t) |
Waste ($/t) |
Total ($/t) |
|
| Average | $2.87 | $2.39 | $2.73 |
Process operating costs have been developed for each major domain. Operating costs were developed using the plant parameters specified in the process design criteria. Table 9 presents the operating cost summary by material type. In addition to the processing costs, LOM rehandle costs equate to $0.93/t moved (or $0.41/t processed when averaged over the LOM).
Table 9 – Process Operating Cost per Material Type (±15%)
| Annual Fixed Processing Costs ($M/y) |
Variable Processing Costs ($/t) | Total | |||
| Oxide | Transition | Fresh | Fixed + Variable ($/t) | ||
| Average | $17.4 | $5.08 | $5.07 | $6.16 | $7.62 |
Total fixed mine level general and administration (“G&A”) costs are estimated at $10.1M annually, these are in addition to the $17.4M in annual fixed processing costs shown in Table 9.
Table 10 shows the LOM total cash cost1 and all-in sustaining costs1 calculated both on a $/payable ounce and $/tonne processed basis. Pre-production mining costs are excluded from these calculations.
Table 10 – Cash Cost and Unit Cost Summary (using $1,600/oz gold price)
| Description | LOM Total ($M) |
LOM Avg. ($/payable oz) |
LOM Avg. ($/t processed) |
| Operating Cost | |||
| Mining | $798 | $261 | $4.95 |
| Processing (inc. Rehandle) | $1,295 | $424 | $8.04 |
| G&A | $150 | $49 | $0.93 |
| Royalties | $318 | $104 | $1.97 |
| Total Cash Cost | $2,561 | $838 | $15.89 |
| Sustaining Capital and Closure | |||
| Sustaining Capital | $235 | $71 | $1.46 |
| Closure | $57 | $19 | $0.35 |
| All-in Sustaining Costs | $2,852 | $933 | $17.71 |
Financial Analysis
An economic analysis has been carried out for the Project using a cash flow model. The model has been constructed using annual cash flows taking into account annual processed tonnages and grades for the CIP feed, process recoveries, metal prices, operating costs and refining charges, royalties and capital expenditures (both initial and sustaining). A payable factor of 99.90% has been assumed for purposes of gold sales.
The financial analysis used a base price of $1,600 per ounce. The financial assessment of the Project is carried out on a “100% equity” basis and the debt and equity sources of capital funds are ignored. No provision has been made for the effects of inflation. Côte d’Ivoire tax regulations are applied to assess the tax liabilities (corprate tax rate of 25%), duties and other levies. Discounting and IRR calculations has been applied mid year from the first year of operation using a 5% discount rate and pre-production capital is deducted on an undiscounted basis. A detailed annual summary cash flow model is provided in Appendix 1 of this release.
Sensitivity Analysis
Table 11 shows the Project sensitivity of the NPV, IRR, Cash Cost and AISC with gold price.
Table 11 – Project Sensitivity
| Gold Price ($/oz) | ||||||||
| Metric | Units | $1,400 | $1,500 | $1,600 | $1,650* | $1,700 | $1,800 | $2,000 |
| NPV5% | $M | $417 | $582 | $746 | $799 | $881 | $1,043 | $1,367 |
| IRR | % | 21.8% | 28.3% | 34.8% | 37.0% | 40.3% | 47.0% | 60.9% |
| Total Cash Cost1 | $/payable oz | $825 | $831 | $838 | $858 | $861 | $869 | $884 |
| AISC1 | $/payable oz | $920 | $927 | $933 | $953 | $957 | $964 | $979 |
| Payback | years | 3.8 | 3.1 | 2.7 | 2.5 | 2.4 | 2.1 | 1.8 |
* Three-year trailing average
Opportunities
Potential opportunities to improve the economics of the Koné Gold Project have been identified:
- The wider Koné Gold Project area and Montage Permit applications to the north host over 100km strike extent of regional scale mineralised structures which are yet untested. These areas have the potential through further exploration to add satellite deposits to the current mine life.
- Continue to engage with stakeholders to maintain ease of Project implementation
Koné Gold Project Definitive Feasibility Study Presentation
A presentation and webcast discussing the Koné Gold Project DFS results will be available on the Company’s website at www.montagegoldcorp.com.
Notes:
- Cash costs per payable ounce of gold and per tonne processed, AISC per payable ounce of gold sold and per tonne processed are non-GAAP financial measures. Please see “Cautionary Note Regarding Non-GAAP Measures”. AISC per payable ounce includes all mining costs, processing costs, mine level G&A, royalties, sustaining capital and closure costs and is adjusted to reflect movements in stockpiles. Cash costs per payable ounce includes all mining costs, processing costs, mine level G&A, and royalties.
CONTACT INFORMATION
Hugh Stuart
Chief Executive Officer
hstuart@montagegoldcorp.com
Adam Spencer
Executive Vice President, Corporate Development
aspencer@montagegoldcorp.com
mobile: +1 (416) 804-9032
ABOUT MONTAGE GOLD CORP.
Montage is a Canadian-based precious metals exploration and development company focused on opportunities in Côte d’Ivoire. The Company’s flagship property is the Koné Gold Project, located in northwest Côte d’Ivoire, which currently hosts a Probable Mineral Reserve of 161.1Mt grading 0.66g/t for 3.42M ounces of gold. The Company released the results of a DFS on the Koné Gold Project on February 14, 2022, outlining a 15-year gold project producing 3.06M ounces of gold at AISC of $933 per ounce over life of mine, with average annual production of 207koz, and peak production of 320koz. Montage has a management team and Board with significant experience in discovering and developing gold deposits in Africa.
The Mineral Reserve Estimate was carried out by Ms. Joeline McGrath of Carci Mining Consultants Ltd. who is considered to be independent of Montage Gold. Ms. McGrath is a member in good standing of the Australian Institute of Mining and Metallurgy and has sufficient experience which is relevant to the work which she is undertaking to qualify as a Qualified Person under NI 43–101.
The Mineral Resource Estimate was carried out by Mr. Jonathon Abbott of MPR Geological Consultants of Perth, Western Australia who is considered to be independent of Montage Gold. Mr. Abbott is a member in good standing of the Australian Institute of Geoscientists and has sufficient experience which is relevant to the commodity, style of mineralization under consideration and activity which he is undertaking to qualify as a Qualified Person under NI 43–101.
QUALIFIED PERSONS STATEMENT
The technical contents of this release have been approved by the following Qualified Persons pursuant to National Instrument 43-101:
- Sandy Hunter: Lycopodium Minerals Pty Ltd.
- Jonathon Abbott: Consulting Geologist, MPR Geological Consultants Pty Ltd.
- Mike Hallewell: Consultant, MPH Minerals Consultancy Ltd.
- Pieter Labuschagne: Consultant, Australasian Groundwater & Environmental Consultants
- Carl Nicholas: Consultant, Mineesia Ltd.
- Joeline McGrath: Consultant, Carci Mining Consultants Ltd
- Tim Rowles: Consultant, Knight Piésold Pty Ltd.
TECHNICAL DISCLOSURE
Data verification programs have included review of QA/QC data, re-sampling and sample analysis programs, and database verification. Validation checks were performed on data, and comprise checks on surveys, collar co-ordinates and assay data. Sufficient verification checks were undertaken on the database to provide confidence that the database is virtually error free and appropriate to support Mineral Resource and Reserve estimation.
A technical report for the Koné Gold Project will be prepared in accordance with National Instrument 43-101 and will be filed on SEDAR at www.sedar.com and on the Company’s website at www.montagegoldcorp.com within 45 days of this press release. Readers are encouraged to read the technical report in its entirety, including all qualifications, assumptions and exclusions that relate to the details summarized in this press release. The technical report is intended to be read as a whole, and sections should not be read or relied upon out of context.
Neither the TSX Venture Exchange nor its Regulation Services Provider (as that term is defined in the policies of the TSX Venture Exchange) accepts responsibility for the adequacy or accuracy of this release.
FORWARD LOOKING STATEMENTS
This press release contains certain forward-looking information and forward-looking statements within the meaning of Canadian securities legislation (collectively, “Forward-looking Statements”). All statements, other than statements of historical fact, constitute Forward-looking Statements. Words such as “will”, “intends”, “proposed” and “expects” or similar expressions are intended to identify Forward-looking Statements. Forward looking Statements in this press release include statements related to the Company’s mineral reserve and resource estimates; the timing and amount of future production from the Koné Gold Project; expectations with respect to the IRR, NPV, payback and costs of the Koné Gold Project; anticipated mining and processing methods of the Koné Gold Project; anticipated mine life of the Koné Gold Project; expected recoveries and grades of the Koné Gold Project; timing for the DFS; and timing for permits and concessions. Forward-looking Statements involve various risks and uncertainties and are based on certain factors and assumptions. There can be no assurance that such statements will prove to be accurate, and actual results and future events could differ materially from those anticipated in such statements. Important factors that could cause actual results to differ materially from the Company's expectations include uncertainties inherent in the preparation of mineral reserve and resource estimates and definitive feasibility studies such as the mineral reserve and resource estimates and the DFS, including but not limited to, assumptions underlying the production estimates not being realized, incorrect cost assumptions, unexpected variations in quantity of mineralized material, grade or recovery rates, unexpected changes to geotechnical or hydrogeological considerations, unexpected failures of plant, equipment or processes, unexpected changes to availability of power or the power rates, failure to maintain permits and licenses, higher than expected interest or tax rates, adverse changes in project parameters, unanticipated delays and costs of consulting and accommodating rights of local communities, environmental risks inherent in the Côte d’Ivoire, title risks, including failure to renew concessions, unanticipated commodity price and exchange rate fluctuations, risks relating to COVID-19, delays in or failure to receive access agreements or amended permits, the impact and progression of the COVID-19 pandemic and other risk factors set forth in the Company’s final prospectus under the heading “Risk Factors”. The Company undertakes no obligation to update or revise any Forward-looking Statements, whether as a result of new information, future events or otherwise, except as may be required by law. New factors emerge from time to time, and it is not possible for Montage to predict all of them, or assess the impact of each such factor or the extent to which any factor, or combination of factors, may cause results to differ materially from those contained in any Forward-looking Statement. Any Forward-looking Statements contained in this press release are expressly qualified in their entirety by this cautionary statement.
NON-GAAP MEASURES
This press release includes certain terms or performance measures commonly used in the mining industry that are not defined under International Financial Reporting Standards (“IFRS”), including cash costs and AISC per payable ounce of gold sold and per tonne processed. Non-GAAP measures do not have any standardized meaning prescribed under IFRS and, therefore, they may not be comparable to similar measures employed by other companies. The Company discloses “cash costs” and “all-in sustaining costs” because it understands that certain investors use this information to determine the Company’s ability to generate earnings and cash flows for use in investing and other activities. The Company believes that conventional measures of performance prepared in accordance with IFRS, do not fully illustrate the ability of mines to generate cash flows. The measures, as determined under IFRS, are not necessarily indicative of operating profit or cash flows from operating activities. The measures cash costs and all-in sustaining costs are considered to be key indicators of a project’s ability to generate operating earnings and cash flows. Non-GAAP financial measures should not be considered in isolation as a substitute for measures of performance prepared in accordance with IFRS and are not necessarily indicative of operating costs, operating profit or cash flows presented under IFRS. Readers should also refer to our management’s discussion and analysis, available under our corporate profile at www.sedar.com for a more detailed discussion of how we calculate such measures.
Appendix 1 – Summary Production and Financial Model